


The measurement area of the CA-410 Small Spot Probe series corresponds to the typical size of the human pupil, and that its measurement distance is close to the eye relief.
CA-VP402 measures a spot of ø2.1mm at a 28(±2) mm working distance of up to 6,000 cd/m2 from 0.002 cd/m2.
The CA-VP404 measures ø4mm at a 30(±2) mm working distance of up to 12,000 cd/m2 from 0.004 cd/m2.
Both probes measure luminance, chromaticity, and flicker at high speed with accuracy and repeatability, while easily and perfectly synchronizing the display frequency.

Application Example: Positioning CA-410 at Exit Pupil of AR Glasses
CA-410 Small Spot Probe series also provides a user-calibration feature. The user-calibration feature will allow probe calibration by specified correction coefficients based on the measurement data taken by other reference instruments*. The focused measurement spot of the probe is the surface of the glasses, not the virtual image that is in a different focal length, which is on a different plane than the fixed working distance of the probe. If the reference data with a focus on the virtual image at the correct focal point can be obtained with other instruments, the CA-410 Small Spot Probe can be calibrated with the reference data and outputs the data corrected with the specified correction coefficients afterward.
*Regarding the reference data, Konica Minolta also offers the CS-2000A spectroradiometer with its specialized attachment, as one of the solutions for the head-mounted display application, which allows measuring spectrum of virtual images corresponding to pupil size. This special attachment measures virtual images with different measurement spot sizes available from ø1mm to ø8mm in steps of 1mm, which are also interchangeable. (See brochure of CS-2000A Pupil-Size Measurement)

Our PC Software CA-S40 comes standard with all probes and supports both Windows and macOS. It provides the special features of fast gamma measurements (see video for demonstration) and display waveform measurements (see video for demonstration).
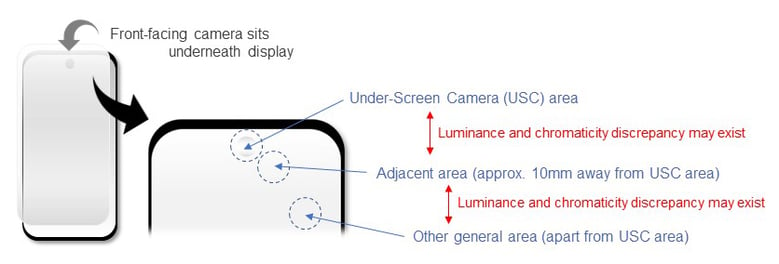
Today, many smartphones use front-facing cameras as part of the full-screen display, positioning the camera behind the screen. This configuration requires two different pixel configurations to exist on the same display, making display gamma correction more complicated. This new positioning can cause a discrepancy in the brightness and color between the area in which the camera sits behind the screen and the other display area in question. Konica Minolta Sensing addresses this challenge with its Display Color Analyzer CA-410 Small Spot Probe. When used in conjunction with a fixture assisting accurate measurement, it can measure the ø2.1 mm spot area directly in front of the camera and compare it to the adjacent area approximately 10 mm away at the same time.
Challenges with Under-Screen Camera Applications
The challenge of the under-screen camera (USC) display application exists with the uniformity issue between the screen located above the front-facing camera area and the rest of the screen. Pixel configurations are different between the two locations, and this will lead to a discrepancy between the two locations on the same screen for luminance and chromaticity. To correct this discrepancy, you need to perform the gamma correction for the USC area separately from the rest of the screen on the same smartphone.
To keep the USC area and the rest of the screen seamless with no color discrepancy, you need a gamma correction for the USC area to allow the color to match the adjacent area. Keeping a consistent color is more complex considering that the OLED displays have color non-uniformity in general, depending on the screen areas. If the display is not uniform between the USC area and the center screen area of the smartphone. In that case, the color difference will make the boundary between the two areas conspicuous, leading to a less than ideal appearance.
What are the Challenges in Creating this Uniformity Between these Two Areas of the Display?
To measure the screen area above the USC is the first challenge; this requires an instrument that can measure a minimal area. Secondly, finding the correct center point is key in measuring the USC area. Taking a measurement off-center can be skew the results. Finally, simultaneous measurements and distance between these measurements should be as close as possible. Simultaneous measurement with dual probes saves operation time, one of the most critical factors considered on the production line. Seamless displays require instruments that can measure and accommodate this new technology. Konica Minolta Sensing offers instruments that can assist in this application.
New Developments
In addition, Konica Minolta Sensing can also discuss the concept of our USC display application measurement system with the use of two
CA-VP402 probes integrated into a fixture, which enables the measurement of the USC area and its adjacent area side by side at the same time.
(See exhibit A)


Exhibit A. Concept of USC Display Application Measurement System (Application example only - fixture is not for sale rather used for illustrative purposes only)
This fixture has a unique optical system applied to realize the simultaneous measurement for both areas at a 10 mm distance. The optional software for this system helps with positioning the probe at the right place on the center point of the area where the camera sits underneath the display by finding each peak luminance of the X (horizontal)-axis and the Y (vertical)-axis. (See exhibit B)
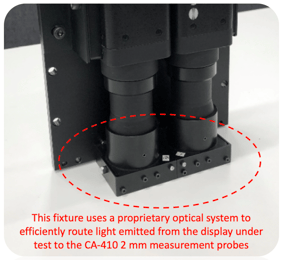
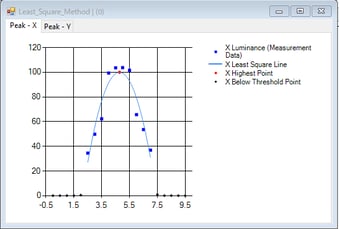
Exhibit B. Concept of USC Display Application Measurement System (Application example only - fixture is not for sale rather used for illustrative purposes only)
Konica Minolta’s CA-VP402 and CA-VP404 Small Spot Probe Address the Need of:
Please feel free to browse our complete portfolio of light and display instruments.
Should you have any questions, please contact us.